


VFR Aeronautical Charts – ICAO
Rogers Data VFR ICAO charts are current and suitable, containing all the information necessary for flying. On one hand Rogers Data VFR charts meet the requirements of ICAO Annex 4 and European Commission Regulations and on the other hand meet the expectations of VFR pilots. We are able to combine the requirements and expectations of VFR pilots for VFR aeronautical charts and provide highly sophisticated and optimized products.
Europe-wide coverage
Rogers Data offers ICAO VFR charts covering all of Europe and beyond. All our charts have the same map image, content, and quality.
Digital availability
Rogers Data ICAO VFR charts are also available digitally from leading and popular app and software providers such as Fore Flight, SkyDemon, Air Navigation Pro, etc.
From pilots for pilots
Rogers Data aviation charts are designed by or in collaboration with commercial pilots. With this know-how and expertise, new charts are created, updated, or adapted.
Rogers Data offers VFR aeronautical charts for Austria and other European countries, as well as other products for pilots and aviation enthusiasts. From north to south, from east to west. From one country to the next. The same map image, the same content and the same quality. No matter which chart sheet you hold in your hands. Enjoy flying with Rogers Data VFR aeronautical charts.
Rogers Data VFR aeronautical charts provide a detailed representation of the respective airspaces. Rogers Data charts are updated annually and are available to pilots at the beginning of the flying season. For the 2021 edition, the range of maps has even been expanded to include Scandinavia and Southeast Europe.
The range of aeronautical charts is aimed in particular at pilots in general aviation, aviation companies and training organizations. “It is a personal concern of mine to meet the needs and expectations of VFR pilots in the best possible way and to contribute to this in flight planning and flight execution through optimized aeronautical charts,” says Ing. Robert Gallmayer, CEO Rogers Data GmbH. “Rogers Data aeronautical charts are optimized to be easily and smoothly integrated into pilots’ information management processes.” Our VFR charts are also used for the Microsoft Flight Simulator Training (FSX) to make the flight in the simulator even more realistic.
The basic information for Rogers Data aviation charts is obtained from the AIPs (Aeronautical Information Publications) of the respective countries and supplemented by our own research, depending on the country. After controlling and adjustment of the data, a uniform map format is created step by step. During production, particular importance is attached to the topographic background map with shading and relief, which conveys a dynamic 3D impression. In addition to these steps, the focus remains on the concept of a consistent map image and uniform map layout. Rogers Data is committed to ensuring that its products are of the highest quality. For this reason, all aeronautical charts are designed by or in collaboration with professional pilots. With this know-how and corresponding expertise, new charts are created or updated and adapted. The motto “From pilots, for pilots” therefore applies.
Charts contents
Rogers Data VFR aeronautical charts provide a highly detailed representation of the respective airspaces. The chart is based on a topographic map with shading and relief. This creates a dynamic 3D impression. The aeronautical charts include TMZ airspaces with mandatory transponder activation, RMZ zones with mandatory radio communication, airports, airfields, and heliports with detailed information. Furthermore, mandatory reporting points, reporting points on request, and border crossing points are included. In addition, radio navigation systems with name, frequency, and identification in Morse code.
Danger areas, restricted areas, flight restriction areas, aviation obstacles or groups of obstacles, air sports areas, areas with recreational activities, and nature reserves with aviation-related restrictions are also marked on the chart. In addition, Rogers Data VFR aeronautical charts are based on the latest aeronautical information from the AIPs (Aeronautical Information Publications). They comply with the relevant provisions of ICAO Annex 4 “Aeronautical Charts” and the relevant EU-Regulations.
Advantages of Rogers Data VFR-ICAO charts
All Rogers Data VFR aeronautical charts feature unique RDtech® lamination technology. With this technology, all charts are virtually tear-proof and can be folded as often as desired. The special lamination minimizes sun reflection and glare and has been tested at temperatures between -20°C and +80°C. Rogers Data charts can be written on using an optimized permanent RDtech® pen set. The marked flight paths and markings can then be removed without leaving any residue using RDtech® spray or RDtech® cleaning wipes. All Rogers Data VFR charts have the same design, chart image, and quality. The uniform appearance makes it easy and straightforward to find your way around the respective chart. In addition to the classic print version, all charts are also available digitally. Having an identical chart image on the screen and on the folding map in your hand proves to be a great advantage. Rogers Data works with numerous app developers and certified NAV installation devices.
Positive response
One feature of Rogers Data aviation charts that is particularly appreciated by pilots is the vivid representation of the terrain with the special topographic background map, which features shading and relief. In addition, the airspace structure is presented very clearly and optimally prepared. CTRs (control zones), RMZs (radio mandatory zones), and airspace restrictions are displayed in red. The airspace is shown in blue, and the nature reserves with aviation restrictions are shown in green.
Try out our Rogers Data VFR aeronautical charts! Enjoy flying with Rogers Data VFR aeronautical charts featuring unique RDtech® technology—whether by airplane, helicopter, glider, paraglider, or when training in a flight simulator (SIM).
National parks and nature reserves
To save pilots the time-consuming task of researching a total of nine Austrian state laws, we have included the national parks and nature reserves relevant to aviation in the Rogers Data VFR aviation charts.

Structure & Content
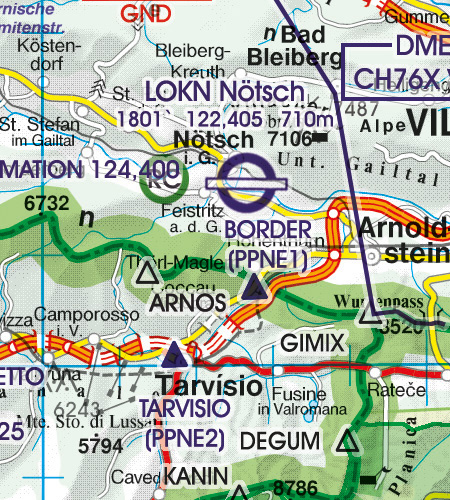
Significant points (border crossing points)
Rogers Data VFR aeronautical charts contain significant points for visual flights.
Pic: Border Crossing Point “ARNOS”, Compulsory Reporting Point “BORDER (PPNE1)”
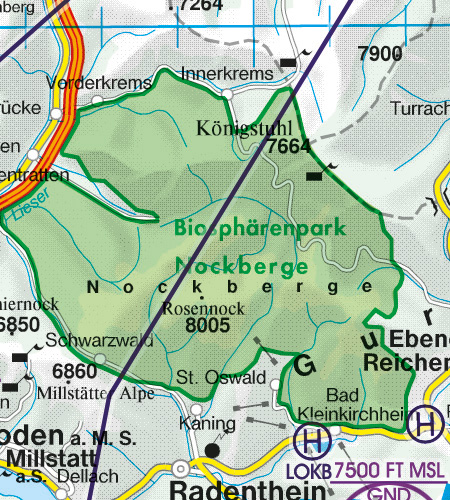
National parks and nature reserves
Rogers Data VFR aeronautical charts include nature reserves and national parks with aviation-related restrictions. They provide a practical overview to help you avoid violating the relevant legal provisions.
Pic: National park “Biosphärenpark Nockberge” in Kärnten
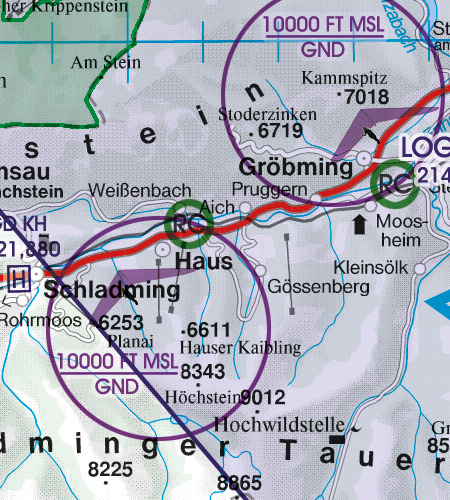
Aerial sporting and recreational activities
Rogers Data VFR aeronautical charts include air sports areas where increased traffic is to be expected, as well as RC (radio controlled) model airfields.
Pic: Luftsportgebiet “Schladming” inklusive dem Modellflugplatz im Gebiet „Haus im Ennstal“
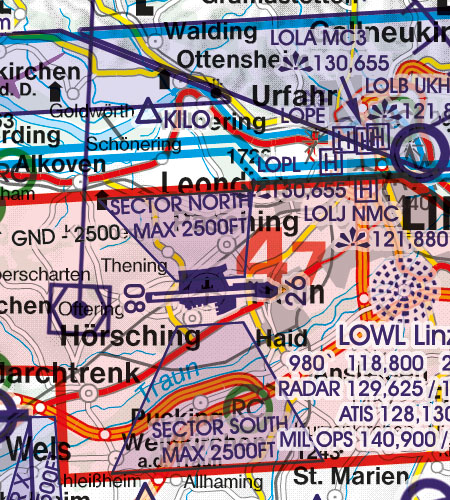
VFR Sectors
Rogers Data VFR aeronautical charts contain approach and departure sectors for airports.
Pic: „SECTOR NORTH“ beim Flughafen LOWL/Linz-Hörsching
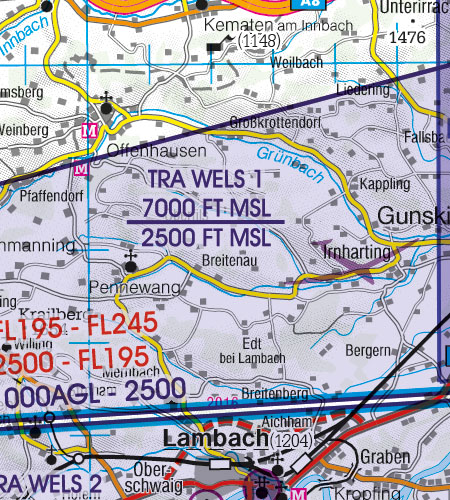
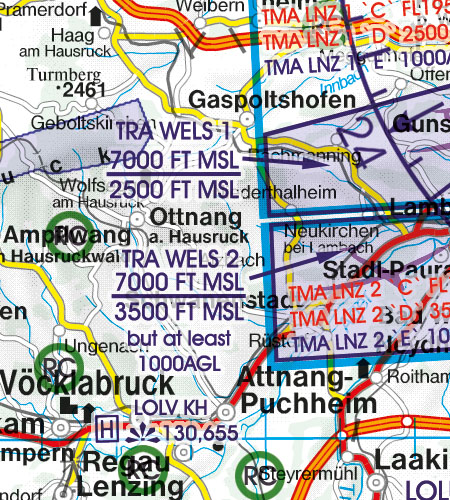
TRA - Temporary reserved airspace
Rogers Data VFR aeronautical charts show Class C and D airspace in vertical and horizontal dimensions. When TRA is activated, this airspace is temporarily classified as Class G.
Pic: TRA „Wels 1“
Model airfields
Rogers Data VFR charts include model airfields RC (radio controlled).
Pic: model airfields (RC) Area Vöcklabruck
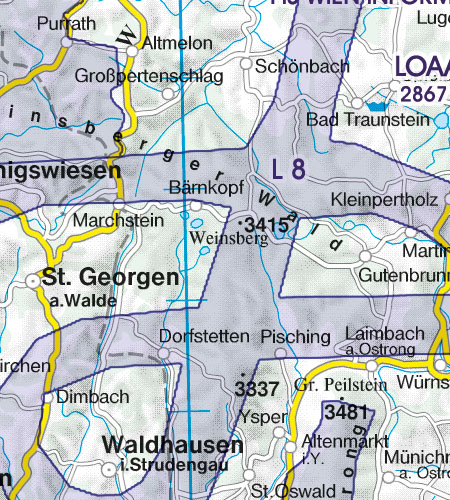
Military exercise and training areas
Rogers Data VFR aeronautical charts include military exercise and training areas.
Pic: Military exercise and training areas / low-altitude flight route
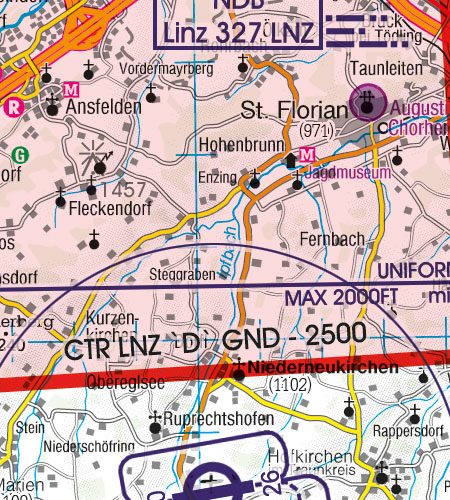
CTR control zones
Rogers Data VFR aeronautical charts include CTR control zones.
Pic: CTR Linz “D” GND – 2500
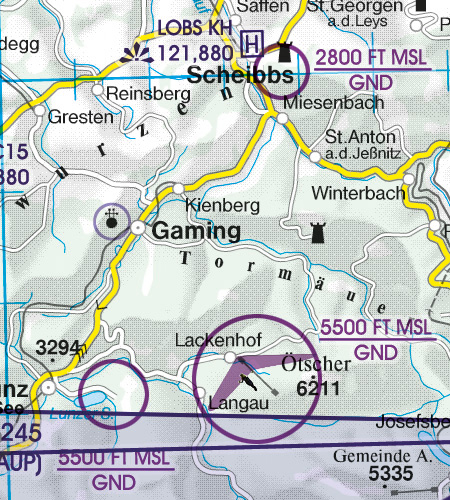
Terrain and topographic background map
Plastic representation of the terrain with a special topographic background map that features shading and relief, creating a dynamic 3D impression.
Rogers Data uses a uniform topographic map throughout Europe that provides the necessary detail in sparsely populated areas or mountainous regions while remaining legible in urban areas.
Display of airspace structure
Rogers Data VFR aeronautical charts display airspace in an optimally legible manner and, thanks to the chosen display format, enable the identification of overlapping airspace boundaries. This facilitates the rapid comprehension of complex airspace structures, such as those found in areas with high traffic density and airports. Spatial visualization and comprehension of the airspace structure are optimally supported.


Back-Up according ICAO Annex 4
As a pilot you should familiarize yourself with the available charts and decide according to your needs and preferences. Despite the increasing popularity of electronic charts, it is only wise to keep backup systems ready to have them available in case you need them. In addition, using multiple systems for navigation allows a pilot to use each system to it`s advantage.
A paper VFR aeronautical chart is still a proven system for flight preparation, flight route selection and provides an overview due to its size.