


VFR Aeronautical Charts – ICAO Charts
Rogers Data provides VFR – ICAO aeronautical charts for Austria and numerous other European countries as well as other products for pilots and aviation entusiasts. From north to south, from east to west. From one country to the next. The same map image, the same content and the same quality. No matter which chart sheet you hold in your hands. Enjoy flying with Rogers Data VFR aeronautical charts.
Rogers Data VFR aeronautical charts feature a detailed representation of the respective airspaces. The Rogers Data charts are updated annually and are all available to pilots at the beginning of the flying season. For the 2021 issue year, the range of charts has even been expanded to include some countries in the direction of Scandinavia and south-eastern Europe.
The range of aeronautical charts is aimed in particular at pilots in general aviation, aviation companies and training organizations. “It is a personal concern of mine to meet the needs and expectations of VFR pilots in the best possible way and to contribute to this in flight planning and flight execution through optimized aeronautical charts,” says Ing. Robert Gallmayer, CEO Rogers Data GmbH. “Rogers Data aeronautical charts are optimized to be easily and smoothly integrated into pilots’ information management processes.” Our VFR charts are also used for the Microsoft Flight Simulator Training (FSX) to make the flight in the simulator even more realistic.
The basic information for the Rogers Data aeronautical charts is obtained from the AIPs (aeronautical information publication) of the national states and, depending on the country, supplemented by our own research. After thorough examination and implementation of adjustments to the data, a uniform chart format is created step by step. During production, special emphasis is placed on the topographic background map with shading and relief, which gives a dynamic 3D impression. In addition to these work steps, the concept of a consistent map image and uniform chart layout is kept in focus. Rogers Data’s main concerns is to ensure that its products are of the highest quality. For this reason, all aviation charts are designed by or in collaboration with professional pilots. This know-how and expertise is used to create new charts or to update and adapt existing charts. Therefore, the motto “From pilots for pilots” applies.
Charts content
Rogers Data VFR aeronautical charts – ICAO charts have a very detailed representation of ATS airspace structures. We use a high-quality topographic map with shading and relief. This creates a dynamic 3D impression. The charts include TMZ transponder mandatory zones, RMZ radio mandatory zones, airports, aerodromes and heliports with additional information, compulsory reporting points, reporting points on request, significant points (border crossing), Radio Navigation Aids with name, frequency and morse code.
Danger-, restricted- and prohibited areas, obstacles or group of obstacles and aerial sporting and recreational activities and areas with sensitive fauna. All Rogers Data VFR aeronautical charts are based on the latest aeronautical information from AIP and their supplements of CAA. They are based on the relevant regulations of ICAO Annex 4 and EU-Regulations.
Advantages of Rogers Data VFR-ICAO Charts
All Rogers Data VFR aviation charts feature the unique RDtech® lamination coating technology. With this technology, all charts are tear resistant and can be folded as many times as needed. The special lamination minimizes solar reflection, mirroring and has been tested at temperatures between -20°C and +80°C. The Rogers Data charts can be written on with an optimized permanent RDtech® pen set. The marked flight paths and markings can be removed afterwards with a RDtech® spray or RDtech® cleaning wipes without leaving any residue. All Rogers Data VFR charts have the same design, the same chart image and the same quality. The uniform appearance makes it easy to find one’s way around the respective chart.
Positive Feedback
A feature of Rogers Data aeronautical charts appreciated by pilots is especially the realistic representation of the terrain with the special topographic background map, which has shading and relief. Furthermore, the airspace structure is very clearly displayed and optimally prepared. Thereby CTRs (Control Zones), RMZs (Radio Mandatory Zones) and airspace restrictions are displayed in the color red. The airspace with its structure is shown in blue and the nature reserves with flying restrictions are shown in green.
So give it a try. Enjoy flying with Rogers Data VFR charts with the unique RDtech® technology – whether by plane, helicopter, glider, paraglider or flight simulator training (SIM).


Europe-wide Coverage
Rogers Data provides VFR – ICAO aeronautical charts of whole Europe.

Digital Availability
Rogers Data VFR charts are also available as digital charts from market-leading and popular app and software providers.

From Pilots for Pilots
All aeronautical charts are designed by or in collaboration with professional pilots.
Advantages of Rogers Data VFR ICAO Charts
1. europe-wide coverage – same design and contents
2. digital availability from market-leading and popular app and software providers
3. border crossing points
4. areas with sensitive fauna
5. aerial sporting and recreational activities
6. VFR sectors
7. TRA – temporary reserved airspaces
8. CTR control zone
9. according ICAO Annex 4, EU-Regulations and AIP
10. detailed representation of the respective airspaces with color
11. topographic background map with shading and relief
12. special coating suitable for labelling
13. all aeronautical charts are designed by or in collaboration with professional pilots!
14. the best is just good enough. From pilots for pilots!

Structure & Contents
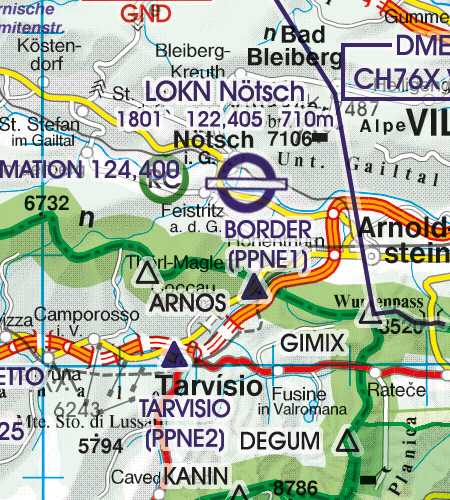
Border Crossing Points
Rogers Data VFR charts contain significant points for visual flights.
Picture: Border Crossing Point “ARNOS”, Compulsory Reporting Point “BORDER (PPNE1)”
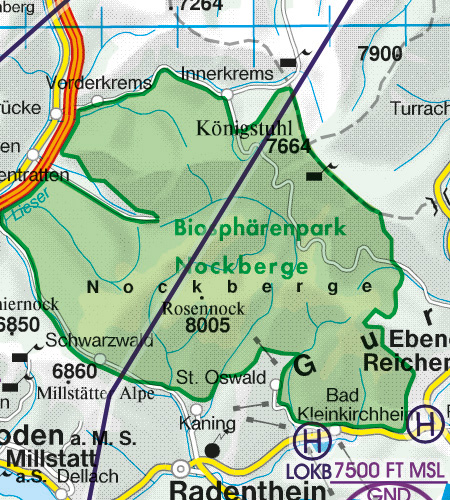
National parks und nature reserves
Rogers Data VFR aeronautical charts contain nature reserves and national parks with restrictions regarding aviation. They provide a practical overview to avoid violations of the relevant legal provisions.
Picture: National park “Biosphärenpark Nockberge” in Carinthia
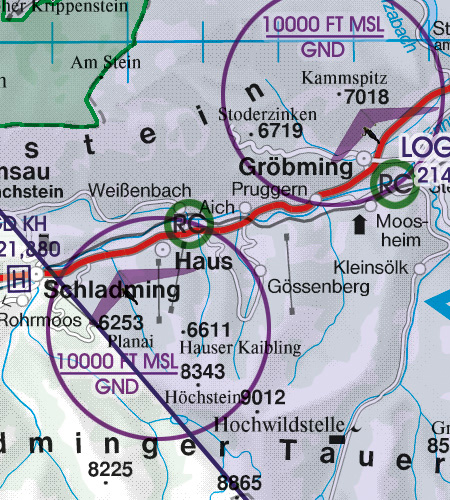
Aerial sporting and recreational activities
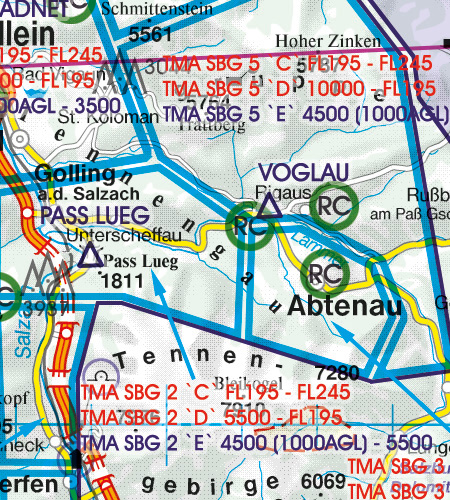
Rogers Data VFR aeronautical charts contain the aerial sporting areas where increased traffic and RC (radio controlled) model flying has to be expected.
Picture: Aerial sporting and recreational area “Schladming” including the RC model flying area in “Gebiet Haus im Ennstal”
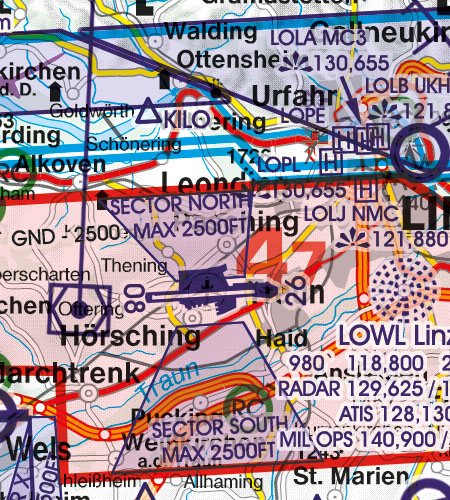
VFR Sectors
Rogers Data VFR aeronautical charts contain arrival- and departure sectors.
Picture: „SECTOR NORTH“ at the airport LOWL/Linz-Hörsching
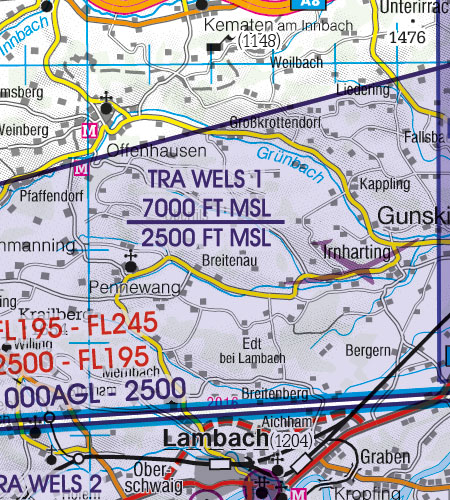
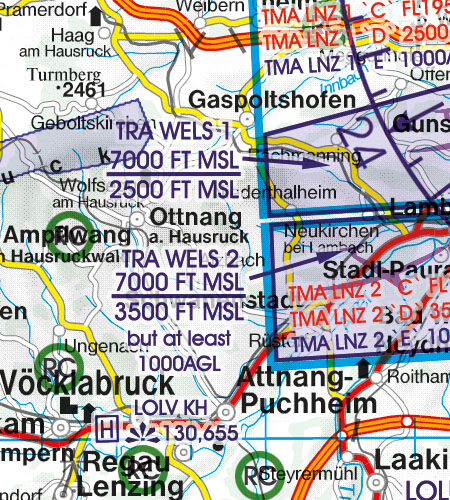
TRA - Temporary reserved airspace
Rogers Data VFR aeronautical charts contain Airspaces classified as airspace C and D, published in vertical and lateral dimensions. When a TRA is activated this airspace changes temporary to class G.
Picture: TRA „Wels 1″
model flying
Rogers Data VFR aeronautical charts contain areas with RC (radio controlled) model flying.
Picture: model flying (RC) Area Vöcklabruck
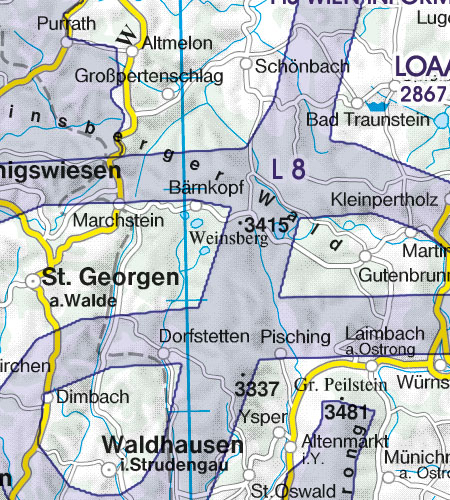
Military exercise and training areas
Rogers Data VFR charts contrain military exercise and training areas.
Picture: Military exercise and training areas
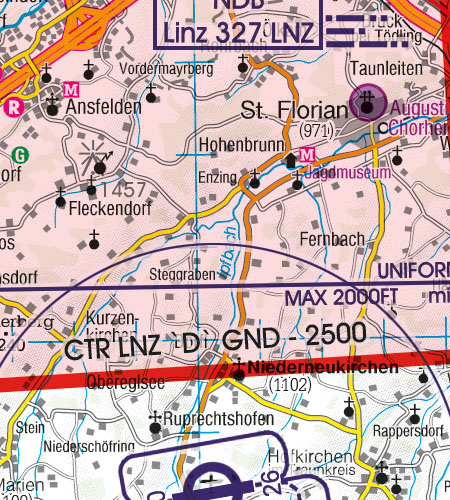
CTR control zones
Rogers Data VFR charts contain CTR control zones.
Picture: CTR Linz “D” GND – 2500
Terrain and topographic background map
Plastic representation of the terrain with the special topographic background map, which has shading and relief and gives a dynamic 3D impression. Rogers Data uses a uniform topographic map throughout Europe, which provides the necessary level of detail in sparsely populated areas or in mountainous regions and remains easy to read even in metropolitan areas.

Display of airspace structure
Rogers Data VFR aeronautical charts provide an optimal readable display of airspaces and, due to the selected display, allow the recognition of overlapping airspace boundaries. In each airspace box the airspace limits are
clearly marked (listed). This makes it possible to quickly capture and understand even complex airspace structures, such as those found around high-density airfields and airports.
National parks und nature reserves
Back-Up Systems
Back-Up acc. ICAO Annex 4
As a pilot you should familiarize yourself with the available charts and decide according to your needs and preferences. Despite the increasing popularity of electronic charts, it is only wise to keep backup systems ready to have them available in case you need them. In addition, using multiple systems for navigation allows a pilot to use each system to it`s advantage
The paper chart is indispensable for theoretical pilot training. But also for the future a paper VFR aeronautical chart is still a proven system for flight preparation, flight route selection and provides an overview due to its size. ICAO Annex 4 regulates that a suitable back-up system may include the carriage of paper charts. By taking the Rogers Data VFR aeronautical charts – ICAO charts in paper version with you, you are conform with the regulations for a back-up system.
20.6 Back-up arrangements to Annex 4 to the Convention on International Civil Aviation
To ensure safe navigation in case of a failure of the Electronic Aeronautical Chart Display — ICAO, the provision of adequate back-up arrangements shall include:
a) facilities enabling a safe takeover of display functions in order to ensure that a failure does not result in a critical situation; and
b) a back-up arrangement facilitating the means for safe navigation of the remaining part of the flight.
Note.— A suitable back-up system may include the carriage of paper charts.
A major advantage of Rogers Data VFR aeronautical charts – ICAO charts is the fact that they are available in digital versions and print versions. You can see the same chart image on the screen and on the printed map that you are holding in your hand.

Changes in Airspace after printing
Changes in airspace structure that occur after chart printing will be published on this page and incorporated into the Rogers Data VFR digital charts.